Output
This page describes the files and directories produced by TaxTriage. All paths are relative to --outdir (your specified output folder).
Most Important Files
These are the outputs you should review first after a successful run:
| File | Location | Description |
|---|---|---|
| Combined ODR PDF | report/all.odr.pdf | All-sample Organism Discovery Report with confidence-ranked pathogen table |
| Per-sample ODR PDF | report/<sample>.odr.pdf | Single-sample ODR |
| Interactive Comparison | report/all.odr.html | Multi-sample interactive comparison report. See Interactive Report. |
| MultiQC Report | report/multiqc_report.html | QC stats and alignment metrics across all samples |
| Krona Plot | report/combined_krona_kreports.html | Interactive radial abundance visualization from Kraken2 |
| Microbial Sheet | report/<sample\|all>.odr.txt | Full tabular data backing the ODR PDF |
| Annotated Workbook | report/<sample\|all>.odr.xlsx | Excel workbook of the ODR data, including VF/AMR annotation and a Metadata sheet |
Directory Structure
<OUTDIR>/
├── report/
│   ├── all.odr.pdf                       # Combined Organism Discovery Report
│   ├── <sample>.odr.pdf                  # Per-sample ODR
│   ├── all.odr.html                      # Multi-sample interactive comparison report
│   ├── all.odr.txt                       # Combined microbial sheet
│   ├── all.odr.xlsx                      # Combined annotated workbook (incl. VF/AMR + Metadata)
│   ├── <sample>.odr.txt                  # Per-sample microbial sheet
│   ├── <sample>.odr.xlsx                 # Per-sample annotated workbook
│   ├── export_data/                      # Combined data export (--export_data): report tables as xlsx/csv
│   ├── multiqc_report.html               # MultiQC report
│   └── combined_krona_kreports.html      # Krona plot
│
├── alignment/
│   ├── <sample>.<sample>.dwnld.references.bam      # Post-alignment BAM (+ .csi index)
│   ├── <sample>.histo.txt                          # Coverage histogram
│   ├── <sample>.paths.json                         # Per-sample data backing the interactive report
│   └── <sample>_removal_stats_by_taxid.xlsx        # Conflict / LCA read-removal stats per taxid
│
├── samtools/
│   └── <sample>.txt                      # Per-reference coverage
│
├── bcftools/                             # (--reference_assembly only)
│   ├── <sample>.<taxid>.vcf.gz          # Variant calls
│   └── <sample>.consensus.fa            # Consensus assembly
│
├── fastqc/                              # (Illumina)
│   ├── *_fastqc.html
│   └── *_fastqc.zip
│
├── fastp/                               # (--enable_fastp, Illumina)
│   └── *.fastp.html / *.fastp.json / *.fastp.log
│
├── fastplong/                           # (--enable_fastp, ONT/PacBio)
│   └── *.fastplong.html / *.fastplong.json / *.fastplong.log
│
├── nanoplot/                            # (ONT)
│
├── mergedkrakenreport/
│   └── krakenreport.merged_mqc.tsv      # Top hits per sample from Kraken2
│
├── top/
│   ├── <sample>.top_report.tsv          # Per-sample top hits table
│   ├── <sample>.toptaxids.txt           # Top taxids selected for alignment
│   └── <sample>.topnames.txt            # Top organism names
│
├── download/
│   └── <sample>.dwnld.references.fasta  # Downloaded reference sequences
│
└── pipeline_info/
    ├── execution_report.html
    ├── execution_timeline.html
    ├── execution_trace.txt
    ├── pipeline_dag.svg
    └── software_versions.yml
Output File Details
FastQC (fastqc/)
Standard FastQC outputs for Illumina samples:
*_fastqc.html- Interactive quality metrics report*_fastqc.zip- Archived report with raw data
Note: FastQC in the MultiQC report shows untrimmed reads and may contain adapter sequences.
Sequence count distribution: 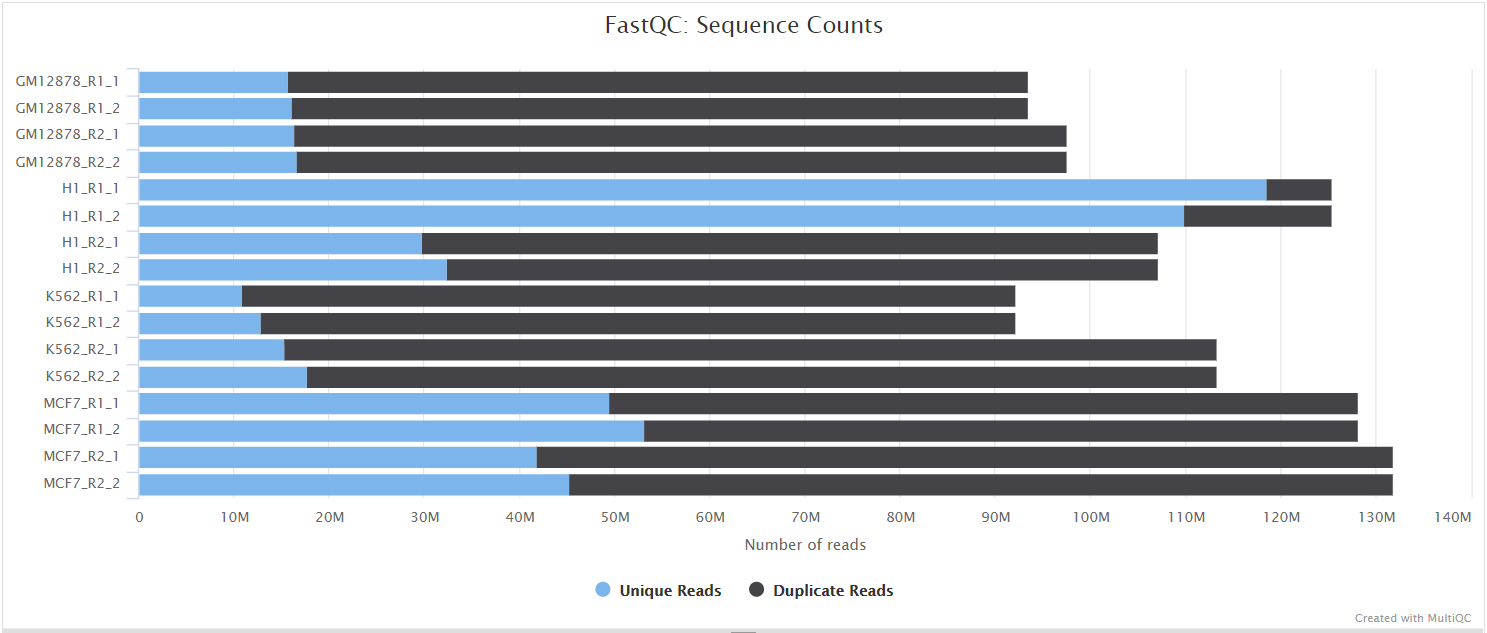
Mean quality scores: 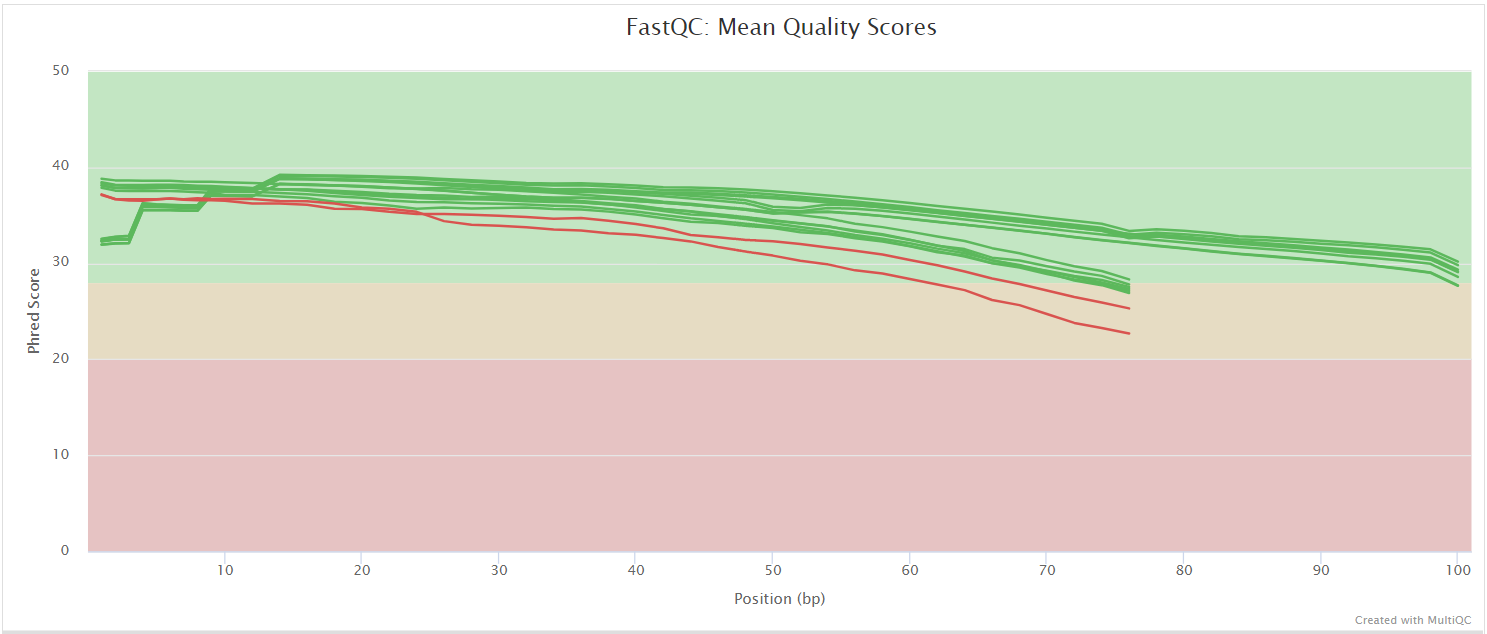
Adapter content: 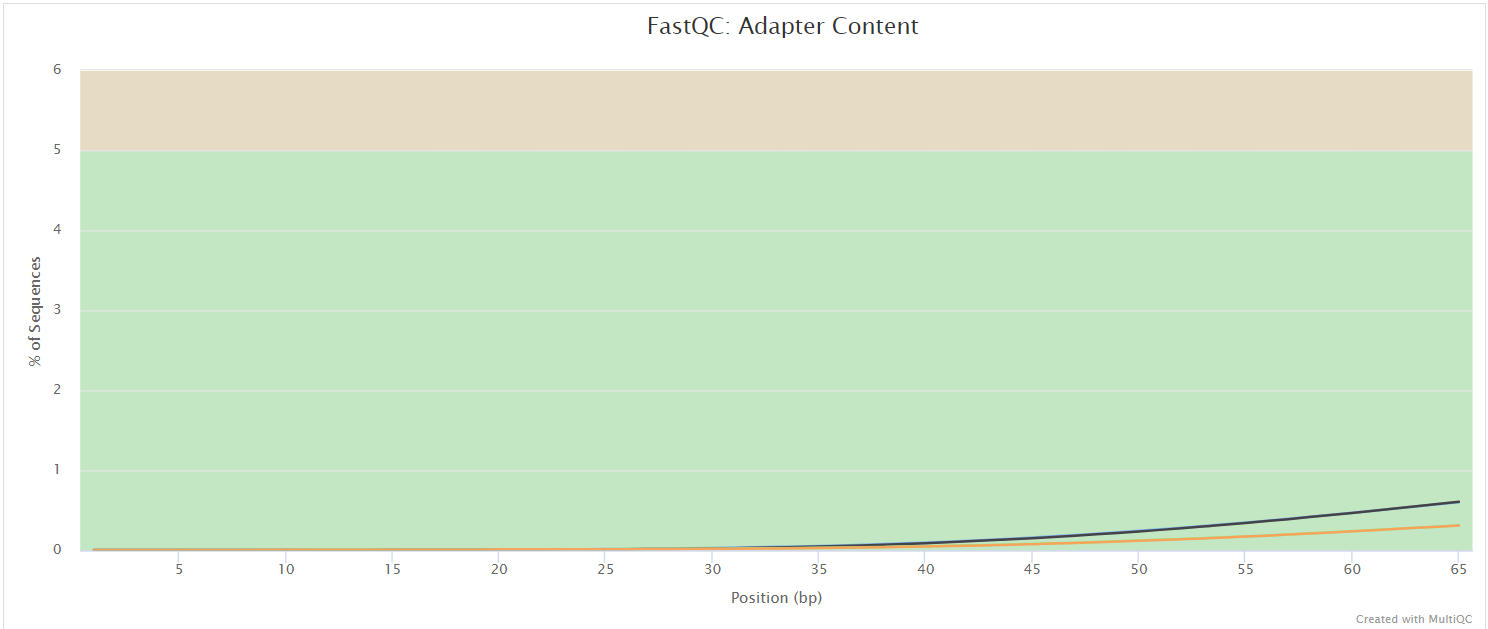
MultiQC (report/multiqc_report.html)
Aggregated report across all samples, including:
- FastQC / NanoPlot summaries
- Trim Galore (cutadapt) trimming stats (for samples with
trim=TRUE) - fastp / fastplong filtering stats (only with
--enable_fastp; the section is omitted otherwise) - Alignment statistics from samtools
- Kraken2 classification summary
- Software version traceability
Organism Discovery Report PDF
The main deliverable. Example report:


Each table row is one detected organism with the following key columns:
| Column | Description |
|---|---|
| Organism | Detected organism with associated annotation, taxID, and taxonomic rank |
| TASS Score | Confidence score for organism detection (0 - 100), with higher values indicating greater confidence |
| Classifier Reads | Number of reads assigned to the organism by Kraken2/Centrifuge |
| Aligned Reads | Number and percentage of total sample reads that align to the organism's reference genome |
| RPM | Reads Per Million (RPM), a normalized abundance metric that enables comparison across samples |
| % Coverage | Percentage of the organism's genome covered by aligned reads |
| Control Comparison | Displays an organism's TASS score relative to control samples |
See TASS Scoring for full definitions of each metric.
Interactive Comparison Report (report/all.odr.html)
A self-contained, browser-based report that compares every sample in the run side by side, with a TASS heatmap, summary table, coverage/sunburst/explore views, a per-sample-type TASS cutoff slider, species/genus roll-up views, whole-sample QC flags, and a built-in Export-to-PDF button. No server is required - the file can be emailed or hosted as-is. See the dedicated Interactive Report page for a full walkthrough.
Samples flagged by a QC rule (--report_flag_*, or rules added in the report itself) are marked here, not removed: the file still carries every sample's data, so clearing a rule brings a hidden sample straight back. See Interactive Report → Sample QC flags.
Combined Data Export (report/export_data/) - Optional
Written only with --export_data. Holds the interactive report's tables as spreadsheets - detections, per-sample summary, cross-sample organism rollup, coverage, VF/AMR, novelty, run metadata, geography and in-silico - so the data is usable without opening the HTML. The shape depends on --export_data_formats: a single taxtriage.combined.xlsx (a sheet per table), taxtriage.wide.xlsx / .csv (everything joined on Specimen ID × Organism), one CSV per table, taxtriage.stacked.csv, and/or taxtriage.pivot.* (detections crosstabbed against a metadata field). See CLI Parameters → Combined Data Export.
Microbial Sheet (report/<sample>.odr.txt)
Tabular plain-text version of the ODR data. Contains all organisms including commensals and potentials regardless of --show_commensals / --show_potentials flags.
Annotated Workbook (report/<sample>.odr.xlsx)
Excel version of the same data with VF/AMR protein-annotation columns (when annotation is enabled) and an appended Metadata sheet describing the run.
BAM Files (alignment/<sample>.<sample>.dwnld.references.bam)
Post-alignment BAM files (with a .csi index) for all top-hit organisms. Can be viewed in IGV or any BAM-compatible viewer.
Per-sample JSON (alignment/<sample>.paths.json)
Structured per-sample results that back the interactive comparison report. These are the preferred input to make_report.py.
Read-removal Stats (alignment/<sample>_removal_stats_by_taxid.xlsx)
Per-taxid breakdown of how many reads were removed during conflict resolution, including the LCA-aware (species/genus) accounting used when scoring closely related strains. See TASS Scoring.
Coverage File (samtools/<sample>.txt)
Per-reference coverage summary produced by samtools coverage for each top-hit organism.
Variant Files (bcftools/) - Optional
Available when --reference_assembly is enabled:
- VCF files with variant calls per taxid
- Consensus FASTA assembled from the reference + variants
Pathogen Sheet
The pipeline uses a curated pathogen annotation sheet with ~1,600 taxa at assets/pathogen_sheet.csv.
Updating the Pathogen Sheet
You can modify the sheet or provide your own with --pathogens. Required columns:
name- Organism name (doesn't need to match NCBI exactly)taxid- NCBI taxonomy IDgeneral_classification-Primary,Opportunistic,Potential, orCommensal(see Microbial Categories for definitions, site-aware resolution, and interpretation)high_consequence-TRUE/FALSE- always shown in PDF regardless of TASS score
Optional but recommended:
pathogenic_sites- Comma-separated body sites where this organism is pathogeniccommensal_sites- Sites where this organism is commensal (overrides general classification for those sites)assembly_accession- CuratedGCF_*/GCA_*assembly to pin for this organism. When set, it is downloaded directly (accession-first) instead of the pipeline picking an assembly by taxid; see Assembly Selection Order. Auto-generated during the database build and kept as the last column; leave blank to let TaxTriage choose.
To request new organisms be added to the default sheet, open a GitHub issue.
Working Directory (work/)
Nextflow stores all intermediate process files in work/. These are not final outputs but are used when resuming a pipeline with -resume.
To free disk space after a successful run:
⚠️ Deleting
work/prevents future-resumefrom reusing cached results.